Introduction:
Test conducted on August 18, 2023. In pursuit of scientific data through independent clinical testing, HealthTech Reporter collaborated with the Integrative Health Research Center (NYC) to conduct this private single case study and efficacy monitoring of biometric response of PEMF frequency waves.
Dr. Robert Bard, chief investigator designed this case study with high resolution 3D RESONA 7 Ultrasound System by MINDRAY, NA. (complete technical info below).
The use of of the Aurawell PEMF (AuraWave model) was applied during this test. ONE clinical participant was pre-qualified, then exposed to PEMF treatment to the QUADRICEPS muscle area for a given period of time and under a specific frequency. The clinical imaging specialist employed various applications of a medical-grade ultrasound to monitor any visible physical reactions or movements during the time of the bioenergy treatment exposure.
PHASE 1: PREFLIGHT EXPLORATORY MICRO-TEST
Prior to launching a comprehensive device performance test, Dr. Robert Bard (and his technical team) initiates a standard short term, preflight test phase. This cost-effective one-scan measure is an exploratory pass-fail initiator of the given hypothesis. In this case, the client (AuraWell PEMF) wishes to record any identifiable evidence of muscle motion as a result of the PEMF frequency induction.
Strategically, the research team proceeded by testing a lower-powered PEMF model (first) called the NOVA-HD to adequately challenge the sensitivity of the ultrasound scanner(s) used in this energy induction study. Upon treatment, the imaging technician simultaneously scanned the designated muscle with B-mode high resolution ultrasound. Adjusting the PEMF device’s power level from 1-10, the M-mode echocardiography transducer was activated and recorded the intrinsic contraction timed to the pulse frequency.
To validate results of physiological intervention, this study is designed to detect tissue/muscular motion. This is to be noted as intrinsic to muscular contraction and not muscle motion (generated elsewhere) such as squeezing the calf when you're looking at the thigh muscle. The imaging team employed the intrinsic echocardiogram feature called M-mode (or motion mode) to verify that the muscular contraction is occurring in the area under investigation. Echocardiographic technology is widely used to track delicate motion of the heart, muscle and valves. Echocardiographic analysis is recognized as the most delicate way of showing (the slightest) motion. For this, we elected to target the quadriceps muscle that was able to offer visual results when the low-powered electromagnetic pulse was activated. Experience and research indicated the muscle composition of the quadriceps has been widely studied for validating effects of other muscle therapeutic solutions (ie. neurostim, shockwave, cold laser etc).
This exploratory phase is the pre-flight test necessary to deploy the full performance study- whereby evidence and indication of response would dictate the execution of a more comprehensive analysis and clinical review. Upon navigation of this test, the RESPONSE from this initial test showed immediate positive results (see scan diagram showing echocardiogram signal irregularity to pulse frequency). Tissue motion is reported as being intrinsic to the pulse stimulus in the quadriceps muscle that was scanned in real time. By this micro-test, we can conclude recordable and visible muscle reaction to the pulse electromagnetic waves from this NOVA HD. This report also extrapolates similar recordable reaction to exposure from the AURA PULSE (same brand with vastly more powerful model) to result in a similar, if not more significant effect.
PHASE 2: COMPREHENSIVE PERFORMANCE REVIEW OF THE AURA PULSE MODEL
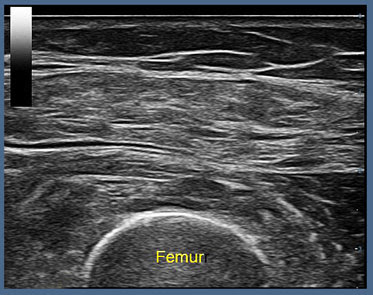
Scan #1 of 7: PRE-TREATMENT SONOGRAM (Pre Quad) 8/18/2023 12:59:49pm
This preflight stage is a pre-treatment review using medical-grade ultrasound probe at 14 MHz frequency with 12 cm penetration and axial resolution of 0.5 mm. Conducted is a transverse scan of the quadriceps muscle. The top set of lines (labeled subcutaneous tissue). Right underneath the firm, fascia is located and between the subcutaneous fascia and the curved white bony femur outlined on the bottom is the interdigitating muscle tissues that form the four tendons of the quadriceps near the patella.
Scan #2 of 7: M-MODE ECHO-CARDIOGRAPHY (Pre Quad) 8/18/2023 1:05:39pm
Real-time scan DURING PEMF exposure
To document motion changes induced by the pulse electromagnetic pulsations, we use the motion mode setting that is used for echocardiography to demonstrate the subtlest movements in the muscle tissue inside the heart. The ammo line is seen as a white band that goes from the skin surface right down and through the curved bony portion of the femur. And the picture below this shows a steady band of horizontal lines without any motion or any change indicating that there is no contractility or motion present in the resting muscle.
Scan #3 of 7: DOPPLER/ No Flow in Box 8/18/2023 1:01:21 pm
Above the level of the femur, there's a box, which is a flow descriptor as this area is looking for arterial or venous blood flow. Notice the color bar on the top left showing directional flow where red is flow towards the probe and blue is flow away from the probe in the box. There is no evidence of color or evidence of any vessels with very low flow that may not show up that are dilated in response to the energy being put in. Hence, applying 3D Doppler Blood Flow feature of the ultrasound, we see NO blood flow or N0 Vessel dilation- indicating very low velocity that is not appearing in hemodynamic readings.
- To Be Continued -
VISUALIZING THE TREATMENT OF INFLAMMATION The Answers Collected from Ultrasound Imaging
Historically speaking, the most favored (and sensible) way to identify the results of any treatment is by tracking the body's immediate response to it. Controlled testing must show the patient's condition PRE and POST effects, where true data-finding is collecting the necessary EVIDENCE of its claims. The investigator can pull a significant amount of data from this form of validation testing: including stage-by-stage bodily response to future projections of possible side effects. Modern diagnostic science looks to imaging for its safe, non-invasive yet quantifiable analyses of what’s under the skin. In this latest review, ultrasound offers a flicker-free visual (10-30 frames per second) of muscle contraction. The “real-time” advantage of video under a 3D Doppler Ultrasound easily and clearly shows the frequency of the muscle bundle’s firing (twitching) indicating fatigue and potential pathology. |
- Continued -
Scan #4 of 7: TREATMENT POWER 10/20 8/18/2023 01:05:39 pm
With the power/frequency setting of 10/20, we employed the circular transducer around the quadriceps in a 360 degree at figuration. The motion of the muscles above this bony femur is seen to have changed from its nice, avoid appearance into something with a midline central ”waist” due to energy transfer to and within the quadriceps muscle.
Scan #5 of 7: M-MODE – PHASIC PULSATILITY NOTED 8/18/2023 01:06:56 pm
Notice the white line in the center of the switching muscle that translates into the transverse linear, and at this time, undulating or contracting muscle fibers as pointed out by the arrow at the initial pulse that reaches the muscle. Below the arrow are motion artifacts that transform the uniform, linear, horizontal lines into an unrecognized pattern of interrupted lines indicating the energy transfer and motion occurring within the muscle structure. The yellow brackets indicating pattern interruptions of muscle stasis showing visible evidence of the energy frequency induction from the PEMF.
Scan #6 of 7: DOPPLER FLOW BOX | 1.8mm VENOUS DILATION - 8/18/2023 01:11:46 pm
Measurement of a dilated vein is visually represented in this doppler flow box of the treated area between the fascia and the bone showing a dilated vein that was previously not present during pre-treatment. The vein measures 1.5 by 1.8 millimeters, and the dilatation implies blood flow of such small magnitude that it doesn't show up as a color on the registration software as the blood flow is too low. However, the fact that the veins are dilating indicates a vascular response to the energy input. The two plus marks are measurement indicators of the vein: at 1.8 mm. That's the vein that that now appeared during PEMF exposure.
Scan #7 of 7: ELASTOGRAPHY
A final (theoretical) step in this pilot study is to employ the diagnostic capacity of the elastogram feature of our ultrasound system. In pursuit of physiological reactions to the PEMF energy induction, we may anticipate fibrosis or hardness or stiffness. According to this scan image, we are able to capture quantitative data in the form of abnormal color which tracks with the value of the hardness or physical elastic change in the muscle fibers. The elastography scale (upper left of screen) from 100 represents very hard tissue or muscle spasm or fibrosis down to zero, indicating fat or soft tissue. From this test, the elastogram reading shows a biometric change from 60 in hardness or spasm down to 30, representing muscle relaxation, thus adding further evidence to the PEMF effects on the condition of musculator.

CONCLUSION: During the pre-treatment (at-rest) phase, there is no identifiable venous dilatation or blood flow. There was no muscular contractility detected by the ultra-sensitive cardiac motion mode technology. Following a treatment at half power (10 out of 20) we can visibly and quantifiably identify that small veins are beginning to dilate and that the contractility of the tissue being energized is appearing as pulse vibrations in the form of the undulating surface line of the muscle. Measurements of change in the internal motion of the muscle fibers are outlined by the brackets (slide 5) immediately during bioenergy/electromagnetic exposure. This phase 1 test was designed to capture preliminary and evidential data of IMMEDIATE muscle/physiological reaction to energy induction therapy. Upon further review of this quantifiable evidence and the physiological behavior of the musculature, one can extrapolate more venous dilatation and more visible blood flow activity if/when more treatment time is provided.

"Choosing The Right Scanner for My Clinical Research Project":
For this pilot study, recognized diagnostic imaging specialist Dr. Robert Bard selected the latest feature-rich MINDRAY ultrasound system: the RESONA 7. "One of my passions is learning about the latest advancements in ultrasound imaging... and thanks to a recent industry showcase, the Resona 7 stood out to me as a well-designed and highly flexible scanner that can handle the many challenges of an exploratory research project."
MANUFACTURER'S OVERVIEW:
The Mindray Resona 7 platform begins with proprietary and industry-first virtual beam-formation technology, ZONE Sonography® Technology+. The acquisition of larger and more robust acoustic data sets coupled with proprietary, industry-first virtual beamforming methods and innovative signal processing techniques translates into a number of unique imaging advantages. These include extremely fast image processing and display for noticeably improved temporal resolution; exceptional image uniformity throughout the field of view with improved spatial and contrast resolution. ZST+ also has the ability to generate novel and exclusive advanced diagnostic applications while improving the performance of established imaging technologies. Virtual beam formation will continue to shape the future of ultrasound imaging in impactful ways, allowing for more powerful technology, improved workflow tools, and the inclusion of more AI-based advancements. ZST+ has paved the way for the future of ultrasound.
Mindray’s High Fame Rate Sound Touch Elastography utilizes the advantages of ZST+ with smoother transition times and faster refresh rates for more consistent acquisition and assessment during live 2D shear wave imaging allowing for more rapid, reliable, and reproducible quantitative results.
Advantages include:
- Patented ultra-wide beam tracking technology improves penetration, especially for stiff tumors, fatty livers, and obese patients
- Rapid acquisition with high reliability for improved efficiency and throughput
- Consistent results with high reproducibility
- Four quality measures for improved inter-operator variability and diagnostic confidence: motion stability, tissue homogeneity, reliability map, and reliability overlay visualization
- Continuous-fire STQ acquisition methods for more results in less time, enhancing the patient experience
- Combination STE and STQ mode for continuous-fire point measurement with the added advantage of quality maps
* This clinical performance test was conducted by: Dr. Robert L. Bard of the AngioResearch Foundation and the Integrative Health Research Center for HealthTech Reporter. Our clinical diagnostic testing team gives special thanks to MINDRAY, NA and AURAWELL PEMF for the equipment donated in the execution of this performance study- without whose generous support this study could not have been made possible.
All images, analytical content and narrative graphics presented in this report are copyright © 2023- Bard Diagnostic Imaging. All Rights Reserved.